

Learning how to trade the Stock Market is without a doubt the best thing that's ever happened to me. Not only in terms of making a good living at it (and allowing me to work at home), but also in the way it keeps me tuned into what's going on in the world.
I'm fifty-three years old and I'm not worried about getting Alzheimer's, because trading the Market is the best brain stimulation exercise regimen I've found yet. This is not easy money. It takes a lot of hard work and many hours a day to study what you need to know in order to be successful.
Over the last fifteen years I've taught myself how to read charts using Technical Analysis, and I've found that charts can actually let you know what's about to happen next.
Charts can give very clear Buy and Sell Signals. But even a master chart technician must know what's going on in the world every day by staying on top of the most recent news. That's why I watch the Stock Market news channel CNBC eight hours a day, five days a week. You must also have a solid understanding of the Fundamental Analysis of each company you trade.
To prove to you the kind of money you can make Day Trading, here are a few examples of real Day Trades I have done recently. I put $21,000. to work when I bought 2000 shares of TSO and made $280. in just three minutes!

Here is another example of a ten minute Day Trade that made $300.00

Here is another example of a seventeen minute Day Trade that made $300.00

Here is another example of an eight minute Day Trade that also made $280.00

This Day Trade took thirty five minutes and made $150.00

You don't need a lot of money to begin trading using my strategy. I can show you how to select good stocks that are less expensive, and that way you can buy a lot more shares and still benefit from smaller moves in share price.
In order to be a successful trader of the Stock Market, you must do all of these things:
1) Keep up with the latest news on the financial markets around the world. That includes know when each report on the Economic Calendar comes out, and which one carry more weight in their ability to move the Market.
2) Know exactly what is going on with the stocks you trade by knowing the Fundamental Analysis of each company you follow.
3) Learn to read and understand charts of each company you trade using Technical Analysis. One thing I've learned is Charts Don't Lie. They don't have emotions. Learn what the chart is telling you, and don't let your emotions get in the way of taking the appropriate action the chart is telling you to take.
When I first started trading, I didn't know anything about the Technical Analysis of Stock Market charts. I had spent a few years watching the live streaming charts that came with my Scottrade account that didn't have any Technical Indicators on them. I was getting pretty good at guessing what would happen next just by observing the patterns I saw develop day after day.
My wife had been trading the Market for many years before I met her, and she told me I needed to learn how to read Chart Patterns.
I found a few websites that offered lessons on the subject, and this one became one of my favorites: www.stockcharts.com
From this website, I learned all about Chart Patterns and all of the Technical Indicators I now use on my charts.
Only after I understood Technical Indicators did I begin to understand why a Chart Pattern would fail to yield the expected result at times. It was because the Technical Indicators said that the Price Per Share (PPS) had moved all it could, and it had met a resistance level.
Once I combined Chart Patterns and Technical Analysis into the reading of a chart I began to have much more consistent success in my trading abilities. It has taken many years of study to get to this point. I started by learning one Technical Indicator at a time until I knew it worked well, and then I would move onto the next one.
Let me give you a little hint here. After learning all about Chart Patterns, one of the first Technical Indicators you should learn is Bollinger Bands. It was the very last one I learned, and it is without a doubt one of the most important ones that I know of. I could have saved myself a lot of pain and suffering, not to mention avoid quite a few trades that didn't go well if I had known all about Bollinger Bands in the beginning of my trading career.
Here are a few examples of the different types of charts I use for doing Technical Analysis. I use different styles of charts because they each have a slightly different look and feel to them, even though the information they give is usually very similar.
There are just a few Technical Indicators necessary for my Day Trading strategy to work. The Commodity Channel Index (CCI) gives very clear and accurate Buy and Sell Signals, and I use Stochastics (STO) to confirm them. Bollinger Bands are also very important in my strategy, and Volume is too. The last two Indicators I use are the 5 Simple Moving Average (5-SMA) and the 15 Simple Moving Average (15-SMA) which also give good Buy or Sell Signals.
The chart of TSO below shows how I setup my charts for Day Trading. I also use three extra Technical Indicators known as the Money Indicators. They basically show if there are more Buyers or Sellers. The dark green one at the top is Chaikin Money Flow (CMF), the yellow line is On Balance Volume (OBV), and the light blue one is the Accumulation/Distribution (A/D) line.
In order for my strategy to work, you don't really need to learn these three additional Technical Indicators. It works fine without them, but if you want to learn how to use them that's okay too. That is an advanced lesson I teach after you have mastered the CCI, Stochastics, Bollinger Bands, and the two Moving Averages.

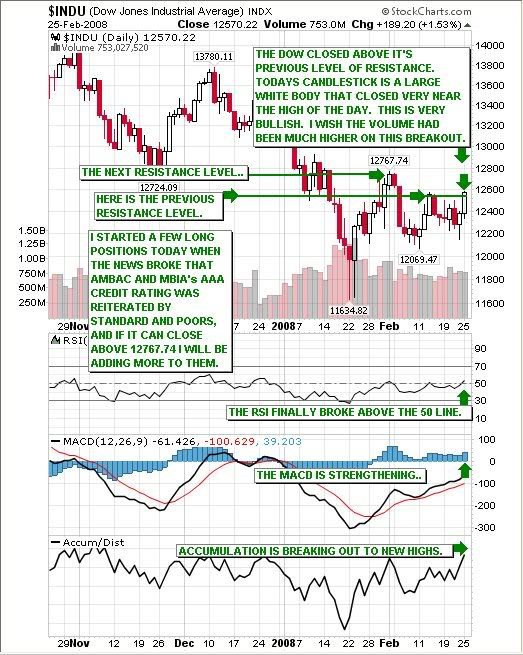
Here is what the charts from stockcharts.com look like. I use this type of chart after the Market has closed for the day. I primarily use this charting service for daily and weekly charts.
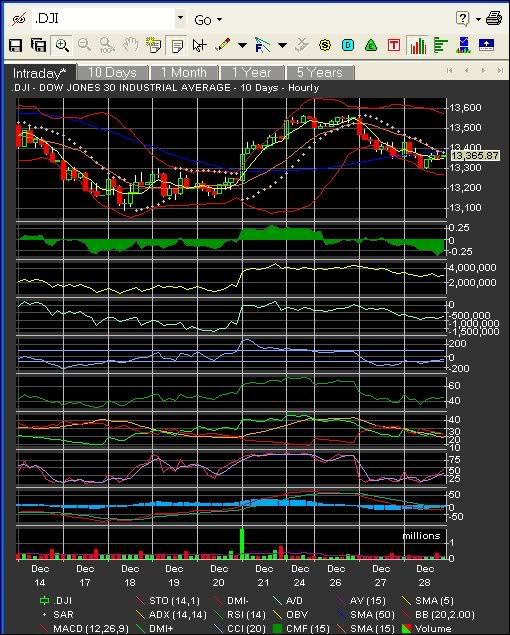
This is a chart from my Fidelity Active Trader Pro trading platform. These are the kinds of charts that I use while the Market is open because their information is streaming in real-time. With these charts, I can get one-minute, five-minute, fifteen-minute, thirty-minute, hourly, daily, weekly, and monthly charts. This is how I set up my charts when I Swing Trade. I use many more Technical Indicators when analyzing longer term charts like the hourly, daily, and weekly charts for Swing Trading.
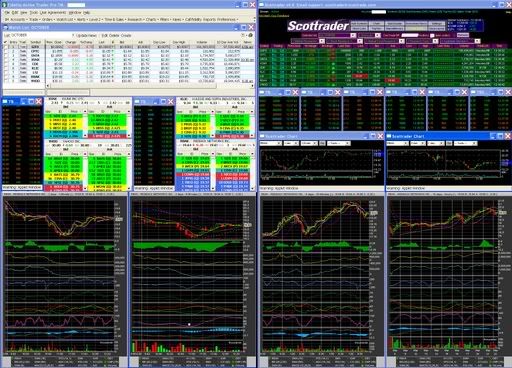
Here is a screenshot of my four monitor trading platform. I combine elements of the Scottrader and the Fidelity Active Trader Pro platforms.
If you are interested in taking lessons on these subjects, I offer private one-on-one mentoring sessions custom designed for each student according to what subjects interest them. If you have any questions about the lessons I offer, don't hesitate to email me at:
info@stock-market-lessons.com
Day Trading is my favorite style of trading. It is a very exiting and lucrative way to trade. If you watch the Video Charts of my Day Trades, you will see exactly how it's done and you will feel the excitement of watching me make hundreds of dollars in less than fifteen minutes.
I also am very proficient at Swing Trading. Most of my Swing Trades only last a few days at most. Each one makes me at least a thousand dollars or more because I always buy at least one thousand shares, and when the PPS goes up one dollar, I've made one thousand dollars.
If the trade doesn't go well, the most important rule in trading the Stock Market is to KEEP YOUR LOSSES TO AN ABSOLUTE MINIMUM! The way I trade is that I know exactly at what price I will exit the trade if it isn't going well. I enter my trades as close to the exit point as possible. My favorite entry is at the second low of a double-bottom chart pattern. That way, if the Price Per Share breaks below the first low, I'm out without a doubt.
The most important rule to trading the Stock Market is CAPITAL PRESERVATION, because without money to trade with, you won't be able to LIVE TO TRADE ANOTHER DAY...
Happy Trading!
Tom


